What are Key Levels (Blue Levels)?
The Key Levels (Blue Levels) indicate the change in control from the hands of Bulls to Bears or vice versa.
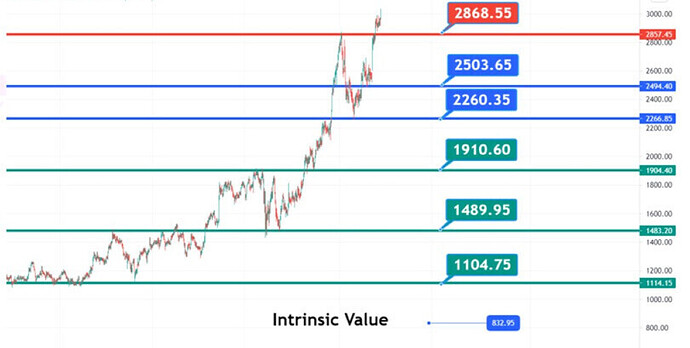
If you look at the graph below, we have plotted levels in 3 different colors. Blue, Red & Green. Out of these 3 colors, the Blue ones are of very high importance.
Bulls are likely to remain in control above 2503.65 (Upper Blue Level) and Bears are likely to get control back when the price moves below 2260.35 (Lower Blue Level). This is how it is interpreted. Let us see how we got here.
How are the Key Levels derived?
We derive these levels based on 4 key inputs.
-
Price Action - How does price behave around certain levels?
-
Open Interest Build-Up - The number of CALL & PUT contracts that have been built at different strikes.
-
Volume
-
Institutional Buying & Selling (FII/DII behavior)
The Key Levels system has the above 4 elements as inputs. You might think - “What’s the Big Deal?”.
Here it is. We track these 4 elements across multiple timeframes (Days, Weeks, Months, Years). Anyone can access the current Charts (Price Action), Open Interest (OI) Build Up, Volume & FII Data on a daily basis. But, it becomes difficult to track the info across weeks, months & years. Even more difficult to process and compute the levels based on the info. We solve this problem for you.
-
How was the Price Action 4 weeks back or 10 weeks back when the price was at a certain level?
-
At which strikes were the maximum CALLs and PUTs built the last time price visited a particular level?
-
Is the market moving with higher volumes compared to last time? Is the volume higher than average?
-
Did FIIs buy or sell on that particular day? How did institutions respond when the price reached 15400?
We store and track these data over several time periods. We give weightage to levels based on Price Action, OI, Volume & Institutional Buying/Selling. The ones with the highest weightage based on the 4 parameters become the Key levels. This is how we arrive at them.
How to use the Key Levels (Blue Ones)?
There are multiple ways to use Key Levels (Blue Levels).
In the chart below, you can see that we have plotted 2 Blue levels. One above (2503.65) and one below (2260.35).
Way 1 - Going Long or Buying on every Dip
If the price trades above the top Blue level (2503.65), then the Bulls are in control. So, we will always look to go long or buy. We will wait for any dips above the level (2503.65) to enter. We will never short as long as the price is trading above 2503.65.
Way 2 - Going Short or Selling on every Rise
Similarly, if the price trades below the bottom Blue Level (2260.35) the Bears are in control. We will look to exit our long positions and go short on every rise. We will never buy or go long from a trading point of view. If there is a big fall in any quality stock, we might look to invest at those levels. But, we don’t trade long positions when the price is below the lower Blue level.
Way 3 - Hold on to positions or Capture premium decay
If the price is between the Blue Levels (2260 and 2503), then it is likely to remain range-bound. Bulls and Bears will continue to fight for control. During this time, we look to Sell options to capture premium decay.
There are several ways in which these levels could be used. We have discussed only a few in this post.
What are the Green & Red Levels?
Those levels act as the Support (Green) & Resistance (Red) above and below the Blue levels. Those are areas for profit booking as historically price has witnessed significant buying/selling around those levels.
Advantages of the Key Levels System
-
Extremely Robust system. Calculated based on current and historic Price action, OI, Volume & Institutional Data.
-
It helps us stay with the trend. By buying above the area where Bulls are in Control and selling below the area where Bears regain control, we always go along with the trend & momentum.
-
It helps us stay prepared. By knowing the key levels, you exactly know what to do during the trading hours. You are never lost.
-
You know when your view is wrong. If you are long the market and you see that price has gone below the lower blue level, then it is an alert that your view has gone wrong and you might have to cut your losses short.
Note: This system is not for predicting the market. It is to understand what is going on and who is in control (Bulls or Bears) and estimate the likelihood (probability) of price movement. This is a plan and not a prediction. The 4 parameters Price Action, Open Interest, Volume & Institutional Behaviour are dynamic and keep changing in the live market. As these parameters change, the risk associated with a particular trade also changes. Appropriate Position Sizing, Risk Management & Hedging will continue to be the differentiators.

